The t-test is a test in statistics that is used for testing hypotheses regarding the mean of a small sample taken population when the standard deviation of the population is not known.
- The t-test is used to determine if there is a significant difference between the means of two groups.
- The t-test is used for hypothesis testing to determine whether a process has an effect on both samples or if the groups are different from each other.
- Basically, the t-test allows the comparison of the mean of two sets of data and the determination if the two sets are derived from the same population.
- After the null and alternative hypotheses are established, t-test formulas are used to calculate values that are then compared with standard values.
- Based on the comparison, the null hypothesis is either rejected or accepted.
- The T-test is similar to other tests like the z-test and f-test except that t-test is usually performed in cases where the sample size is small (n≤30).
Interesting Science Videos
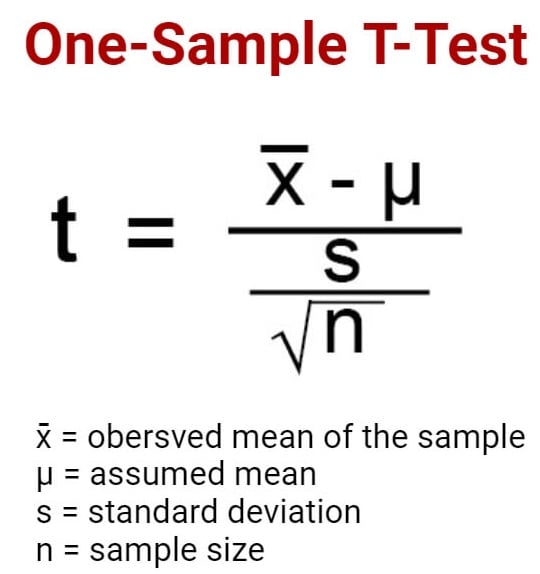
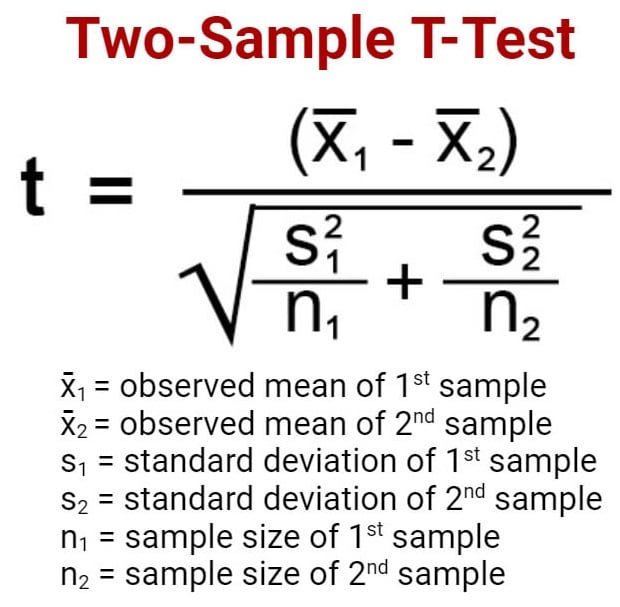
T-test Formula
T-tests can be performed manually using a formula or through some software.
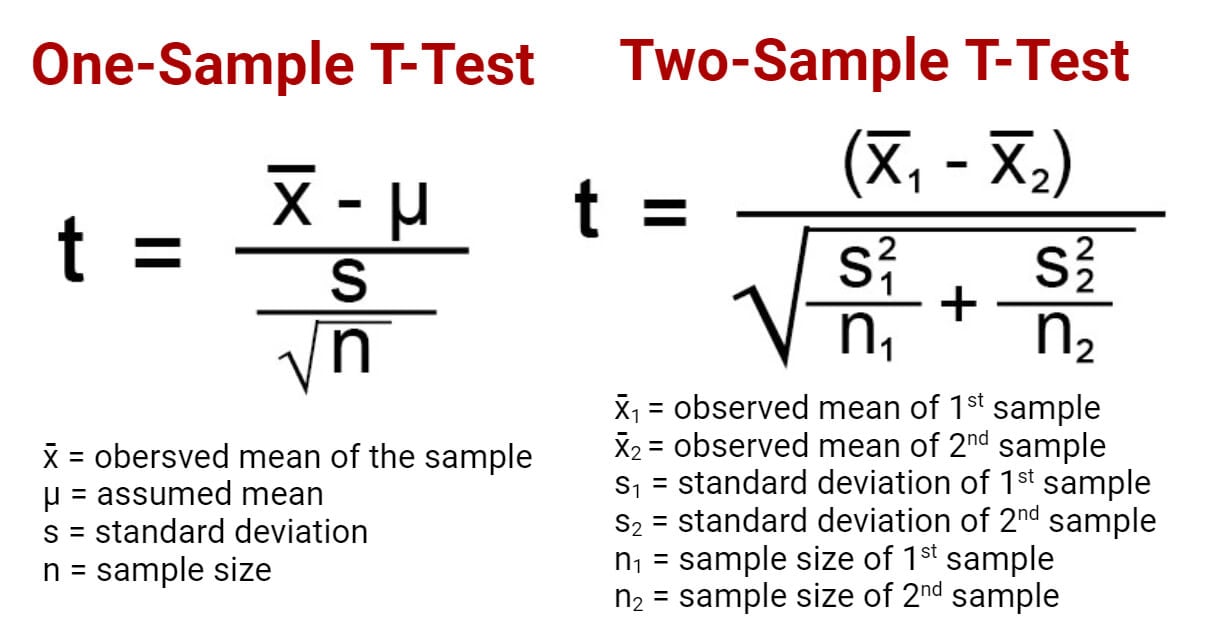
One sample t-test (one-tailed t-test)
- One sample t-test is a statistical test where the critical area of a distribution is one-sided so that the alternative hypothesis is accepted if the population parameter is either greater than or less than a certain value, but not both.
- In the case where the t-score of the sample being tested falls into the critical area of a one-sided test, the alternative hypothesis is to be accepted instead of the null hypothesis.
- A one-tailed test is used to determine if the population is either lower than or higher than some hypothesized value.
- A one-tailed test is appropriate if the estimated value might depart from the sample value in either of the directions, left or right, but not both.
- For this test, the null hypothesis states that there is no difference between the true mean and the assumed value whereas the alternative hypothesis states that either the assumed value is greater than or less than the true mean but not both.
- For instance, if our H0: µ0 = µ and Ha: µ < µ0, such a test would be a one-sided test or more precisely, a left-tailed test.
- Under such conditions, there is one rejection area only on the left tail of the distribution.
- If we consider µ = 100 and if our sample mean deviates significantly from 100 towards the lower direction, H0 or null hypothesis is rejected. Otherwise, H0 is accepted at a given level of significance.
- Similarly, if in another case, H0: µ = µ0 and Ha: µ > µ0, this is also a one-tailed test (right tail) and the rejection region is present on the right tail of the curve.
- In this case, when µ = 100 and the sample mean deviates significantly from 100 in the upward direction, H0 is rejected otherwise, it is to be accepted.
Two sample t-test (two-tailed t-test)
- Two sample t-test is a test a method in which the critical area of a distribution is two-sided and the test is performed to determine whether the population parameter of the sample is greater than or less than a specific range of values.
- A two-tailed test rejects the null hypothesis in cases where the sample mean is significantly higher or lower than the assumed value of the mean of the population.
- This type of test is appropriate when the null hypothesis is some assumed value, and the alternative hypothesis is set as the value not equal to the specified value of the null hypothesis.
- The two-tailed test is appropriate when we have H0: µ = µ0 and Ha: µ ≠ µ0 which may mean µ > µ0 or µ < µ0.
- Therefore, in a two-tailed test, there are two rejection regions, one in either direction, left and right, towards each tail of the curve.
- Suppose, we take µ = 100 and if our sample mean deviates significantly from 100 in either direction, the null hypothesis can be rejected. But if the sample mean does not deviate considerably from µ, the null hypothesis is accepted.
Independent t-test
- An Independent t-test is a test used for judging the means of two independent groups to determine the statistical evidence to prove that the population means are significantly different.
- Subjects in each sample are also assumed to come from different populations, that is, subjects in “Sample A” are assumed to come from “Population A” and subjects in “Sample B” are assumed to come from “Population B.”
- The populations are assumed to differ only in the level of the independent variable.
- Thus, any difference found between the sample means should also exist between population means, and any difference between the population means must be due to the difference in the levels of the independent variable.
- Based on this information, a curve can be plotted to determine the effect of an independent variable on the dependent variable and vice versa.
T-test Applications
- The T-test compares the mean of two samples, dependent or independent.
- It can also be used to determine if the sample mean is different from the assumed mean.
- T-test has an application in determining the confidence interval for a sample mean.
References and Sources
- R. Kothari (1990) Research Methodology. Vishwa Prakasan. India.
- 3% – https://www.investopedia.com/terms/o/one-tailed-test.asp
- 2% – https://towardsdatascience.com/hypothesis-testing-in-machine-learning-using-python-a0dc89e169ce
- 2% – https://en.wikipedia.org/wiki/Two-tailed_test
- 1% – https://www.scribbr.com/statistics/t-test/
- 1% – https://www.scalelive.com/null-hypothesis.html
- 1% – https://www.investopedia.com/terms/t/two-tailed-test.asp
- 1% – https://www.investopedia.com/ask/answers/073115/what-assumptions-are-made-when-conducting-ttest.asp
- 1% – https://www.chegg.com/homework-help/questions-and-answers/sample-100-steel-wires-average-breaking-strength-x-50-kn-standard-deviation-sigma-4-kn–fi-q20558661
- 1% – https://support.minitab.com/en-us/minitab/18/help-and-how-to/statistics/basic-statistics/supporting-topics/basics/null-and-alternative-hypotheses/
- 1% – https://libguides.library.kent.edu/SPSS/IndependentTTest
- 1% – https://keydifferences.com/difference-between-t-test-and-z-test.html
- 1% – https://keydifferences.com/difference-between-t-test-and-f-test.html
- 1% – http://www.sci.utah.edu/~arpaiva/classes/UT_ece3530/hypothesis_testing.pdf
- <1% – https://www.thoughtco.com/overview-of-the-demand-curve-1146962
- <1% – https://www.slideshare.net/aniket0013/formulating-hypotheses
- <1% – https://en.wikipedia.org/wiki/Null_hypothesis
Hi, on the very top, the one sample t-test formula in the picture is incorrect. It should be x-bar – u, not +
Thanks, it has been corrected 🙂