ANOVA Definition
ANOVA (Analysis of Variance) is a statistical tool to test the homogeneity of different groups based on their differences.
- ANOVA is the method of analyzing the variance in a set of data and dividing the variance into groups according to the sources of those variations.
- ANOVA is based on the principle that the total amount of differences in a set of data can be divided into two types, the amount that can be attributed to chance and the other that is caused due to specific causes.
- In a population, ANOVA is used to determine the difference between the means of the samples by analyzing the variation within each of the samples, and relative to the variation between the samples.
- While performing ANOVA, two assumptions are made where the first is that the samples are extracted from a normal population, and the second is that all factors other than those being tested are controlled.
One-way ANOVA
- One-way ANOVA is a short-cut method where a single factor is considered, and its effect on the samples is observed.
- It is a commonly used technique as it is a more convenient method.
- This method is performed when the means of the samples and/or the mean of the sample means are non-integer values.
- One drawback of one-way ANOVA is that it cannot tell which specific groups are different from each other but can tell that at least two groups are different.
- In one-way ANOVA, at least three groups are analyzed as a t-test can be used to determine the difference between two groups.
- Thus, instead of the F-test, the t-test can be performed, which significantly reduces the time and effort. The relation between ANOVA and t-test can be explained as F=t2.
Two-way ANOVA
- The two-way ANOVA technique is used in cases when the given set of data is classified under two different independent factors.
- Here, measurements are taken for each factor separately, and thus the measurements may or may not repeated values.
- The primary purpose of two-way ANOVA is to determine if there is a relation between the independent factors and the dependent factor.
- This technique helps us to determine if the effect of the independent factor on the dependent factor is influenced by the other independent factor or not.
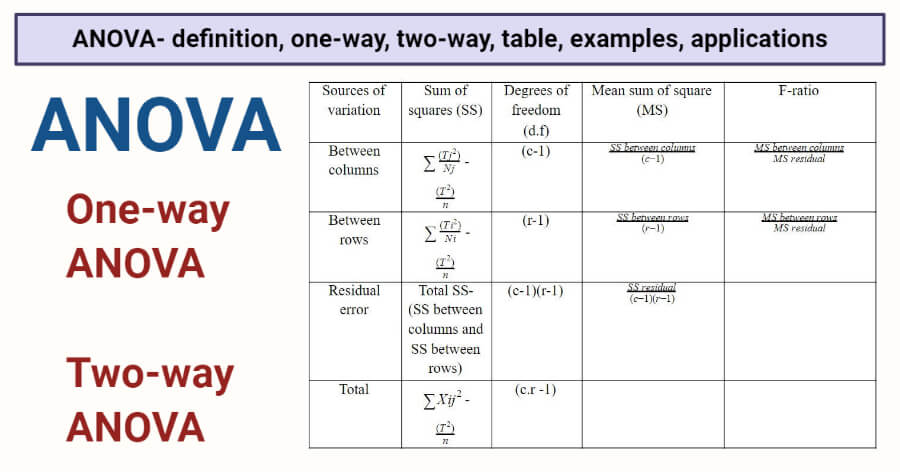
ANOVA Table
- ANOVA table is a tabular form of all the data and calculations performed during the test.
- This makes it more convenient for the observation and calculation of data.
The following is the ANOVA table for two-way ANOVA:
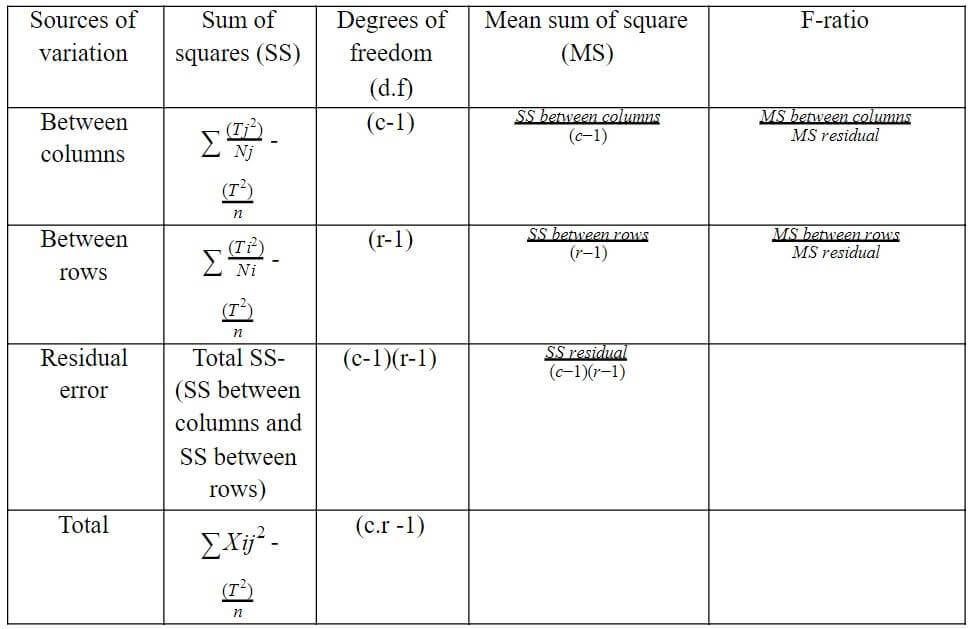
In the table,
c= number of columns
r= number of rows
T= the total of the values of individual items
Tj= the sum of the values in the column
Ti= the sum of the values in the row
- The ANOVA table shows the statistics used to test hypotheses about the population means.
- Here, the F-ratios for rows and columns are compared with their corresponding table values, for the given degree of freedom and given level of significance.
- If the calculated F-ratio is found to be equal or higher than its table value, the differences or variation among the columns are considered significant.
- A similar process is employed for rows to determine the significance of the variation.
ANOVA Examples
- One example of one-way ANOVA is the analysis of the exam performance of students based on their test anxiety.
- One example of the classification of agricultural products on the basis of different seeds and different fertilizers used. Here, the agricultural output is the dependent factor, whereas seeds and fertilizers are independent factors.
Applications
- ANOVA is a useful technique for researches in various fields like economics, biology, education, psychology, sociology, business/ industry, and several other disciplines.
- ANOVA can be used in the agricultural field to determine the relationship between agricultural production and the types of fertilizers used.
- It can also be used to compare the gas mileage given by different automobiles.
References and Sources
- C.R. Kothari (1990) Research Methodology. Vishwa Prakasan. India.
- https://statistics.laerd.com/spss-tutorials/one-way-anova-using-spss-statistics.php
- 2% – https://quizlet.com/88321005/anova-one-way-flash-cards/
- 1% – https://www.wyzant.com/resources/answers/43247/the_larger_the_value_of_the_calculated_f_ratio
- 1% – https://www.wisegeek.com/what-are-the-different-types-of-agricultural-products.htm
- 1% – https://www.wallstreetmojo.com/regression-vs-anova/
- 1% – https://www.slideshare.net/sonustar3/anova-analysis-of-variance-90850361
- 1% – https://www.investopedia.com/terms/a/anova.asp
- 1% – https://www.cliffsnotes.com/study-guides/statistics/univariate-inferential-tests/two-sample-t-test-for-comparing-two-means
- 1% – https://support.minitab.com/en-us/minitab/18/help-and-how-to/modeling-statistics/anova/how-to/one-way-anova/before-you-start/example/
- 1% – https://en.wikipedia.org/wiki/One-way_analysis_of_variance
- 1% – https://courses.lumenlearning.com/wmopen-concepts-statistics/chapter/estimating-the-difference-in-two-population-means/
- <1% – https://www.mathworks.com/help/stats/one-way-anova.html
- <1% – https://en.wikipedia.org/wiki/One-way_ANOVA
- <1% – http://www.fao.org/3/R4082E/r4082e05.htm